

When COVID-19 lockdowns disrupted healthcare in 2020, insurance companies discarded their data; claims had dropped 15%, and patterns made no sense. A new paper in Insurance: Mathematics and Economics shows how to rescue that information by measuring the pandemic’s distortion precisely enough to subtract it.
So, insurers did what seemed reasonable; they threw the data away.
“What surprised me most was the solution insurance companies had found,” says David Moriña, a mathematician at the Universitat Autònoma de Barcelona and affiliated researcher at the Centre de Recerca Matemàtica. “They were discarding 2020 data completely. Just jumping from 2019 forward.”
The move wasn’t irrational. Premium calculations depend on predictable patterns of healthcare usage, and 2020 bore no resemblance to normal years. But it left companies navigating blind through 2021 and 2022, unsure whether post-pandemic behaviour had stabilised. Were the numbers from those years trustworthy, either? Where did the disruption begin and end?
In a paper published in Insurance: Mathematics and Economics, Moriña and his collaborators, Amanda Fernández-Fontelo, also at Universitat Autònoma de Barcelona, and Montserrat Guillén at Universitat de Barcelona, saw a different possibility. What if you could measure the pandemic’s distortion precisely enough to subtract it? The data wouldn’t need to be discarded. It could be corrected.
The work fits into a broader research line Moriña has been developing for some time: methodological proposals for evaluating interventions. “In this case, it’s in the context of health insurance,” he says, “but it’s more general than that.”
The Counterfactual Problem
The mathematical challenge was one of counterfactuals, estimating what would have happened if the pandemic had never occurred. This meant building a model that could predict healthcare usage patterns week by week, trained on pre-pandemic behaviour, then comparing those predictions against what happened.
The gap between prediction and reality quantifies the shock.
“What we expect from data is that it reflects reality in some way. Then, through our methodological proposal, we recover that reality a bit.”
The research team used Bayesian structural time series models, a framework that treats observed data as emerging from hidden states evolving. Think of it as separating signal from noise in a rigorous way. The model captures seasonal patterns, holiday effects, and underlying trends, then forecasts what the “normal” trajectory would have been.
For one of Spain’s largest private insurers, the numbers told a stark story. Median claims rates in 2020 sat 15% below 2019 levels. Then they rebounded: 11% above baseline in 2021, 8% higher in 2022. But those aggregate figures masked profound variation.
People over 60 showed the sharpest initial drop, down 22% in 2020. But unlike younger patients, their usage never recovered. By 2022, it remained 3% below pre-pandemic levels, though the effect wasn’t statistically significant. The data had photographed a grim reality: COVID-19 killed disproportionately among older adults with existing health conditions. Those who survived were, on average, healthier than the 2019 population of over-60 policyholders had been.
A mortality effect, captured as data.
One Model to Fit Many Stories
The methodology treats all healthcare services identically, applying the same mathematical framework to cardiology, oncology, general medicine, and osteopathy. Yet each speciality told a different story.
General medicine barely dipped in 2020, just 1.2% down, because COVID-19 testing ran through those clinics. By 2022, visits were 21% above baseline. Osteopathy, considered less urgent, collapsed by 26% before rebounding to 24% above pre-pandemic levels. Cardiology fell 13% and recovered to 12% above baseline. Oncology held steadier, reflecting that cancer treatments were delayed as little as possible despite hospital strain.
Geography mattered too. Madrid saw a 19% drop in 2020 but only modest increases afterwards: 2.5% above baseline in 2021, 3.2% in 2022. Barcelona and Valencia experienced smaller initial drops (both 12%) but stronger rebounds: Barcelona reached 18% above baseline in 2021, Valencia 21%.
“We propose going in a somewhat finer way, looking at specialities, different cities, different patient subgroups,” Moriña says. “But there’s also a more generic proposal for a general correction.” The choice depends on what data are available and whether the patterns vary enough to justify separate adjustments.
“You have values that allow you to correct this pandemic period in general, without looking at speciality or age or anything,” he explains. “But if you have this information available, then it’s also interesting to look at it because there can be nuances and different behaviours.”
The framework is flexible by design. One correction factor for the whole portfolio, or dozens tailored to age groups, locations, and medical services.
Making the Unusable, Usable
The practical application is straightforward. Insurance analysts typically model expected claims using a Poisson regression, where the number of claims depends on patient characteristics and exposure time (how long a policy was active during the year).
The paper’s correction works through that exposure term. If the pandemic reduced healthcare usage by 15% in 2020, you can think of policyholders as having been exposed to only 85% of a normal year’s worth of healthcare opportunities, even if their policy was active all twelve months. Adjust the exposure accordingly before running the regression, and the model estimates what claims frequency would have been absent the shock.
The team demonstrated this on cardiology data stratified by age and sex. Models fit to 2019 alone, 2020 alone, or all years without correction produced meaningfully different risk estimates. But a model incorporating the shock correction across 2019-2022 synthesised the full dataset into coherent parameters. Older adults showed 1.91 times higher cardiology claim rates than those aged 30-60, net of pandemic effects.
This matters for premium calculations. Using the corrected data, the model estimated what total cardiology costs would have been from 2019-2022 without COVID-19. Against actual costs of roughly €13 million, the counterfactual scenarios suggested the pandemic created between €150,000 and €400,000 in excess costs, depending on the correction’s granularity.
The methodology doesn’t just identify a problem. It provides a usable tool. “Usually what happens is that the methodological proposal we end up developing is applicable beyond the particular problem we wanted to address,” Moriña says. “But I think that’s not necessarily what we’re looking for. I like to start from a specific problem, find a methodology that solves that specific problem, and if it can be generalised, which usually happens, then fantastic.” In this case, generalisation was part of the goal: a method insurance companies could use to incorporate pandemic data into their calculations for risk assessment and premium pricing.
From Mental Health to Gender Violence Reporting
The work is detective work, essentially. You start with hypotheses, follow the clues in the data, and construct a narrative from what the model reveals about reality. “What we expect from data is that it reflects reality in some way,” Moriña says. “Then, through our methodological proposal, we recover that reality a bit.”
That approach defines Moriña’s research more broadly. It requires access to messy, real-world data and understanding what problems researchers are facing. “We work a lot in public health,” he explains, “so we’re interested in knowing what problems they’re finding difficult to approach with classical methodologies, whether because there’s an intervention, or an unexpected shock like the pandemic, and they need innovation or some new method to address these problems that matter to them.”
The collaboration works both ways. “What we bring to researchers, especially in the health field, is this perspective of being able to make a mathematically robust methodological proposal that adapts and allows a response to the question and the problem they’re already addressing,” he says. Researchers come with a problem they need to solve, unconvinced that traditional approaches will give them the answer they need.
“Sometimes we don’t even need to develop a new methodological proposal. With our expertise, we can suggest the best existing way to approach a problem. And when necessary, we develop something new. It’s really the engine that drives the work,” he says. “Starting from a specific problem, and from there finding the methodological proposal that allows us to address it.”
The pandemic shock method, for instance, isn’t limited to health insurance. Any time series disrupted by a sudden external event could, in principle, be corrected the same way. Different fields have different needs and interests, different questions requiring different approaches. But there’s a common thread. “For example, in the field of gender-based violence, it’s not the main focus, but there’s also an underlying line of analysing an intervention”, in that case, training for primary care professionals to help detect cases. The same thread runs through work on vaccine impact and training programs. A current project with Barcelona’s Public Health Agency evaluates the effect of training some primary care teams on paediatric vaccines, while others received no training.
“This line of evaluating interventions is ultimately where this article fits,” Moriña says. “It’s not an intervention, it’s the pandemic, but it’s something that happens and alters the behaviour of a dynamic system or a time series.” Beyond the particular case of insurance data, he sees this rigorous evaluation of interventions as essential. “I think it’s important to scrutinise public policies a bit, and the money invested in these policies, to try to ensure that the interventions being made are efficient and effective.”
Looking forward, his attention remains on public health questions with social translation. Gender-based violence, he notes, is heavily underreported, and primary care clinics could become a key detection point. Mathematical methods that account for hidden cases and assess interventions rigorously might help.
But the insurance paper, published late last year, already suggests one clear implication: that the pandemic’s effects on healthcare data haven’t fully faded. Which raises a question insurers likely haven’t stopped asking: when, exactly, does “normal” return?
about david moriña

David Moriña is associate professor (professor agregat) at the Department of Mathematics of the Universitat Autònoma de Barcelona and affiliated researcher at the Centre de Recerca Matemàtica. Previously he was lecturer at the Department of Statistics of the Universitat de Barcelona (until September 2024), and had postdoctoral stays at research centers as the Center for Research in Environmental Epidemiology and the Catalan Institute of Oncology. His research interests lie in mathematical modeling for epidemiology and public health, with particular focus on health economics. He has led research projects funded by Spanish Ministry of Science and Innovation, the Spanish Ministry of Health and private institutions.
reference
Moriña, D., Fernández-Fontelo, A., & Guillén, M. (2025). Back to normal? A method to test and correct a shock impact on healthcare usage frequency data. Insurance: Mathematics and Economics, 126, 103175. https://doi.org/10.1016/j.insmatheco.2025.103175
Subscribe for more CRM News
|
|
CRM CommPau Varela
|

Hong Wang wins the Fields Medal, a year after her Kakeya lecture at the CRM
Hong Wang (NYU Courant and IHES) has received the Fields Medal at the International Congress of Mathematicians in Philadelphia, alongside Yu Deng (University of Chicago), John Pardon (Stony Brook University) and Jacob Tsimerman (University of Toronto). In June 2025,...
A Conference on Nonlinear PDEs on the Occasion of Xavier Cabré’s Anniversary
One anniversary, eight speakers, July and PDES (People, Discussions, Emotions and Summer) in BarcelonaThe conference Nonlinear PDEs was held at the Institut d'Estudis Catalans (IEC) on 6 and 7 July 2026. While PDEs usually stand for Partial Differential Equations, the...
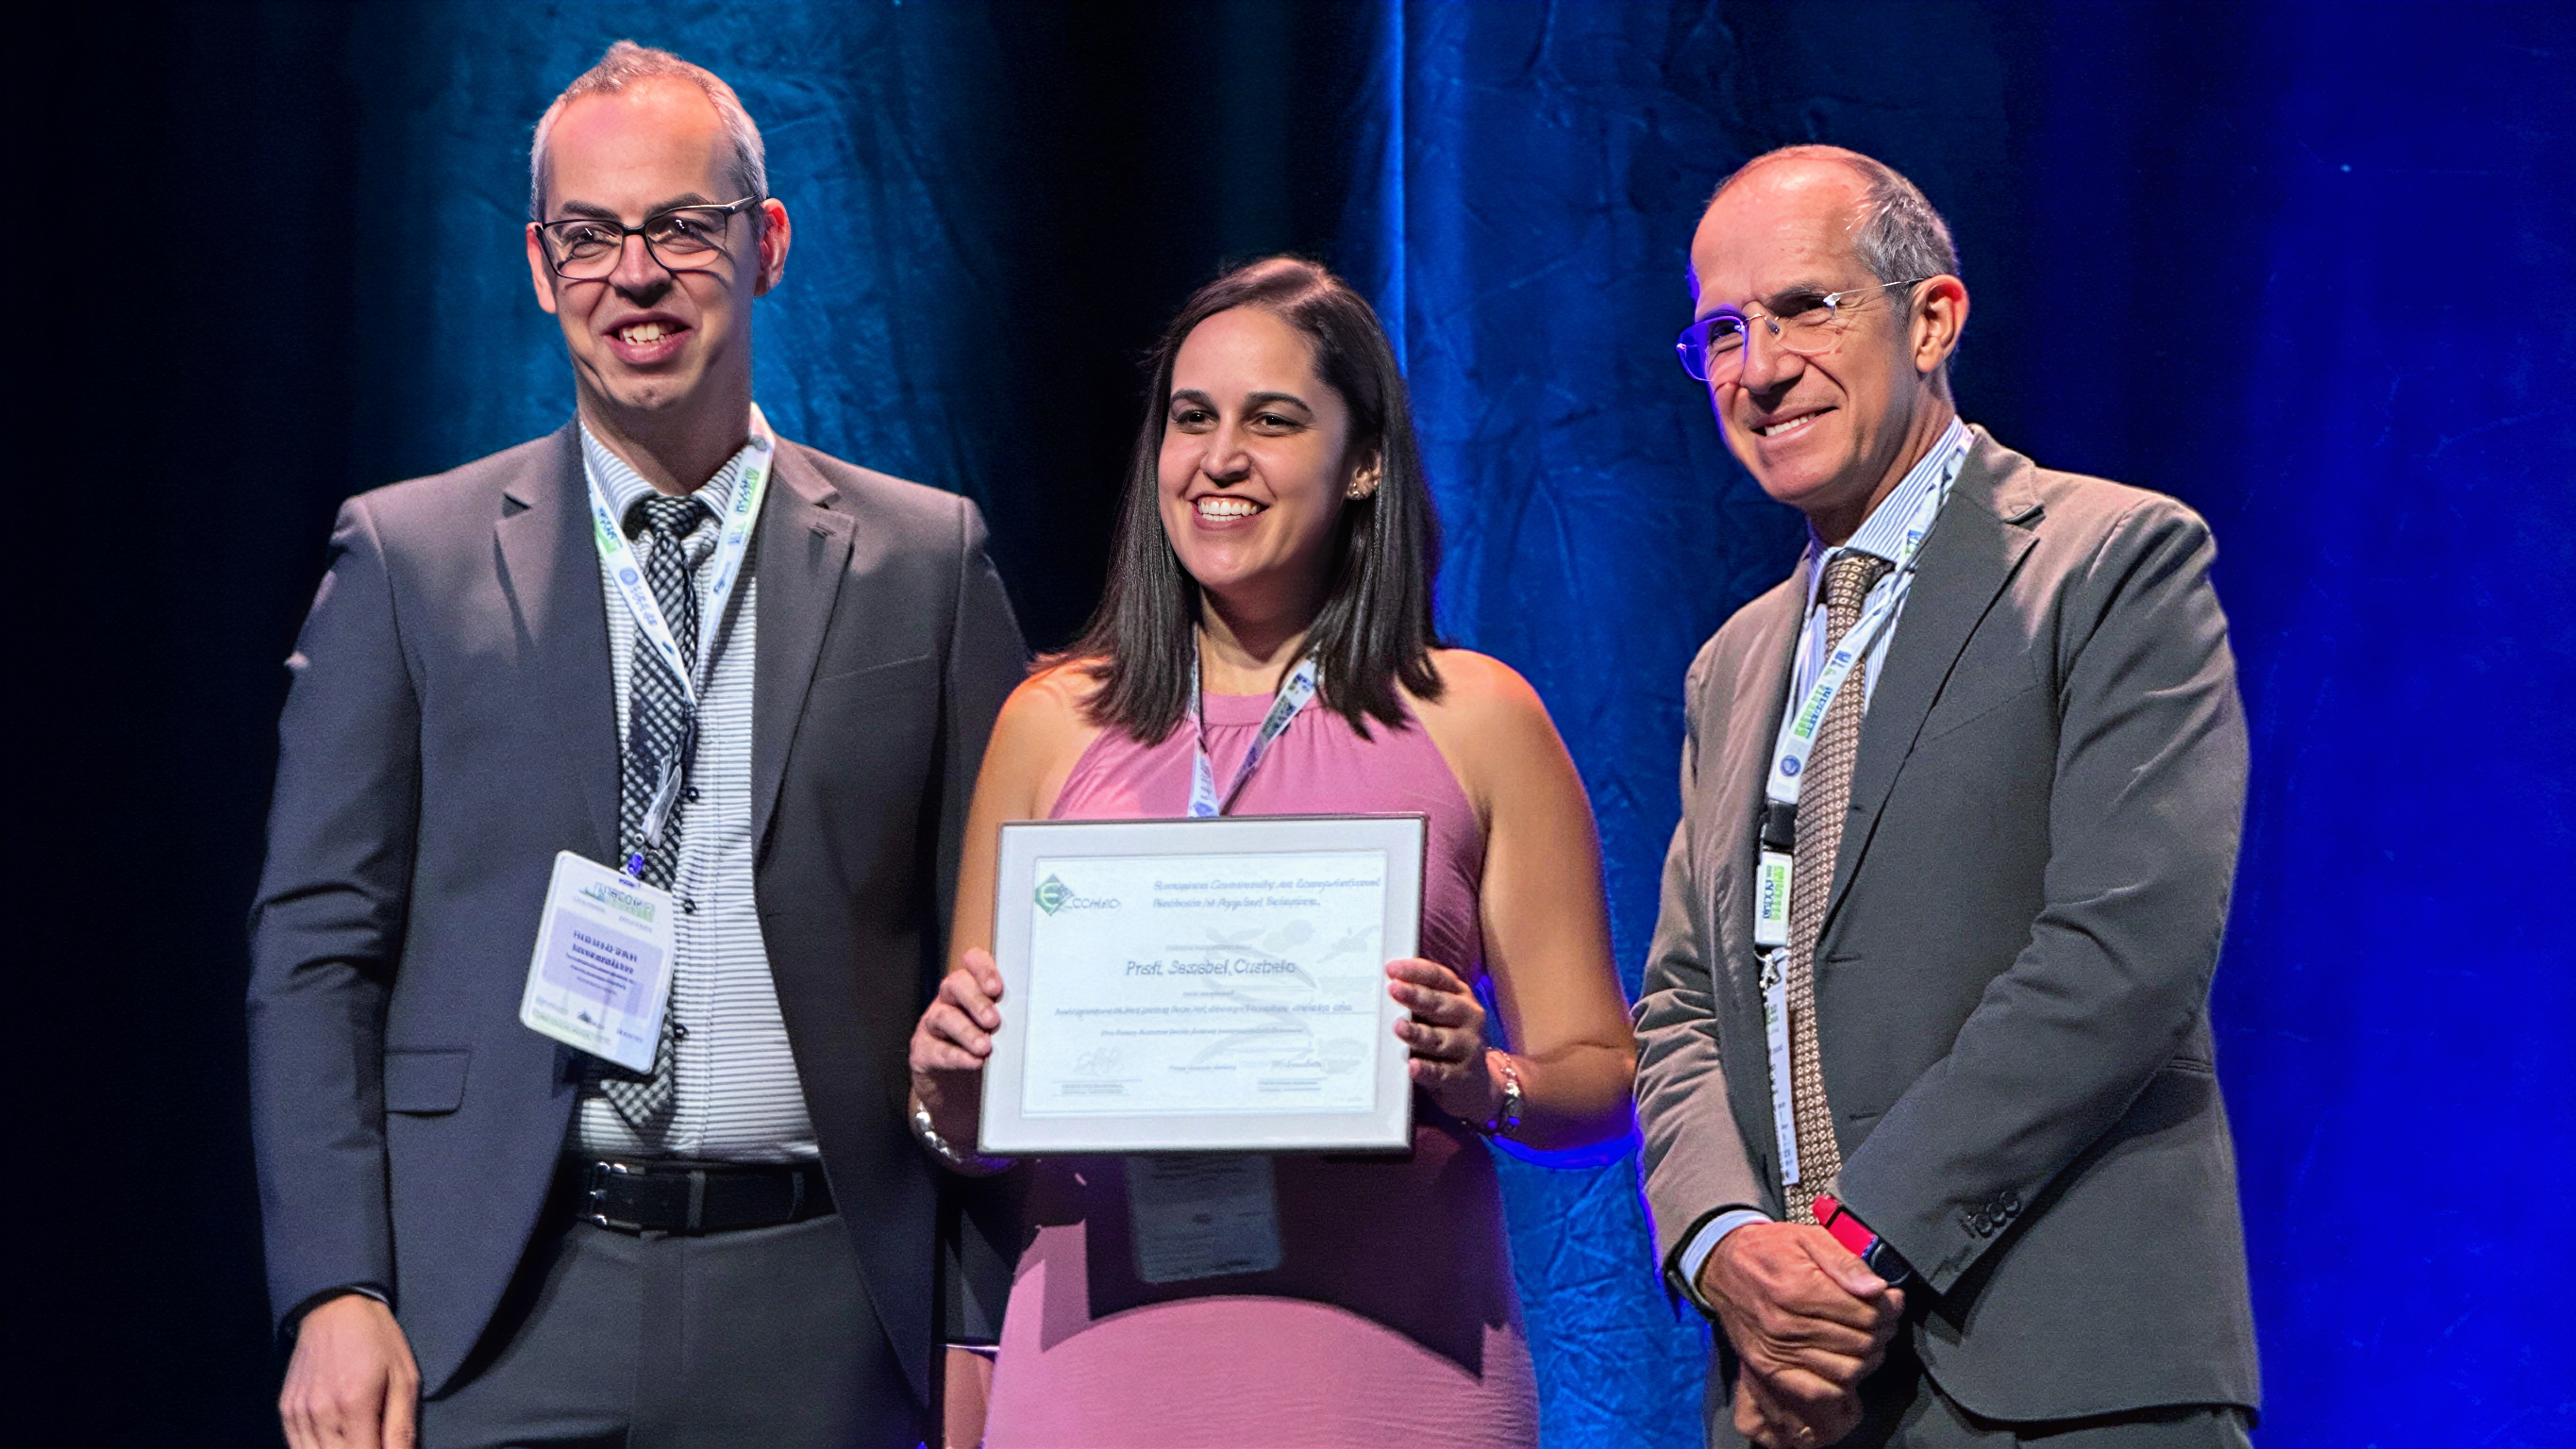
Jezabel Curbelo receives the 2026 ECCOMAS Jacques-Louis Lions Award
Jezabel Curbelo, full professor at the Universitat Politècnica de Catalunya and affiliated researcher at the Centre de Recerca Matemàtica, has been awarded the ECCOMAS Jacques-Louis Lions Young Investigator Award 2026, in the field of computational mathematics. The...
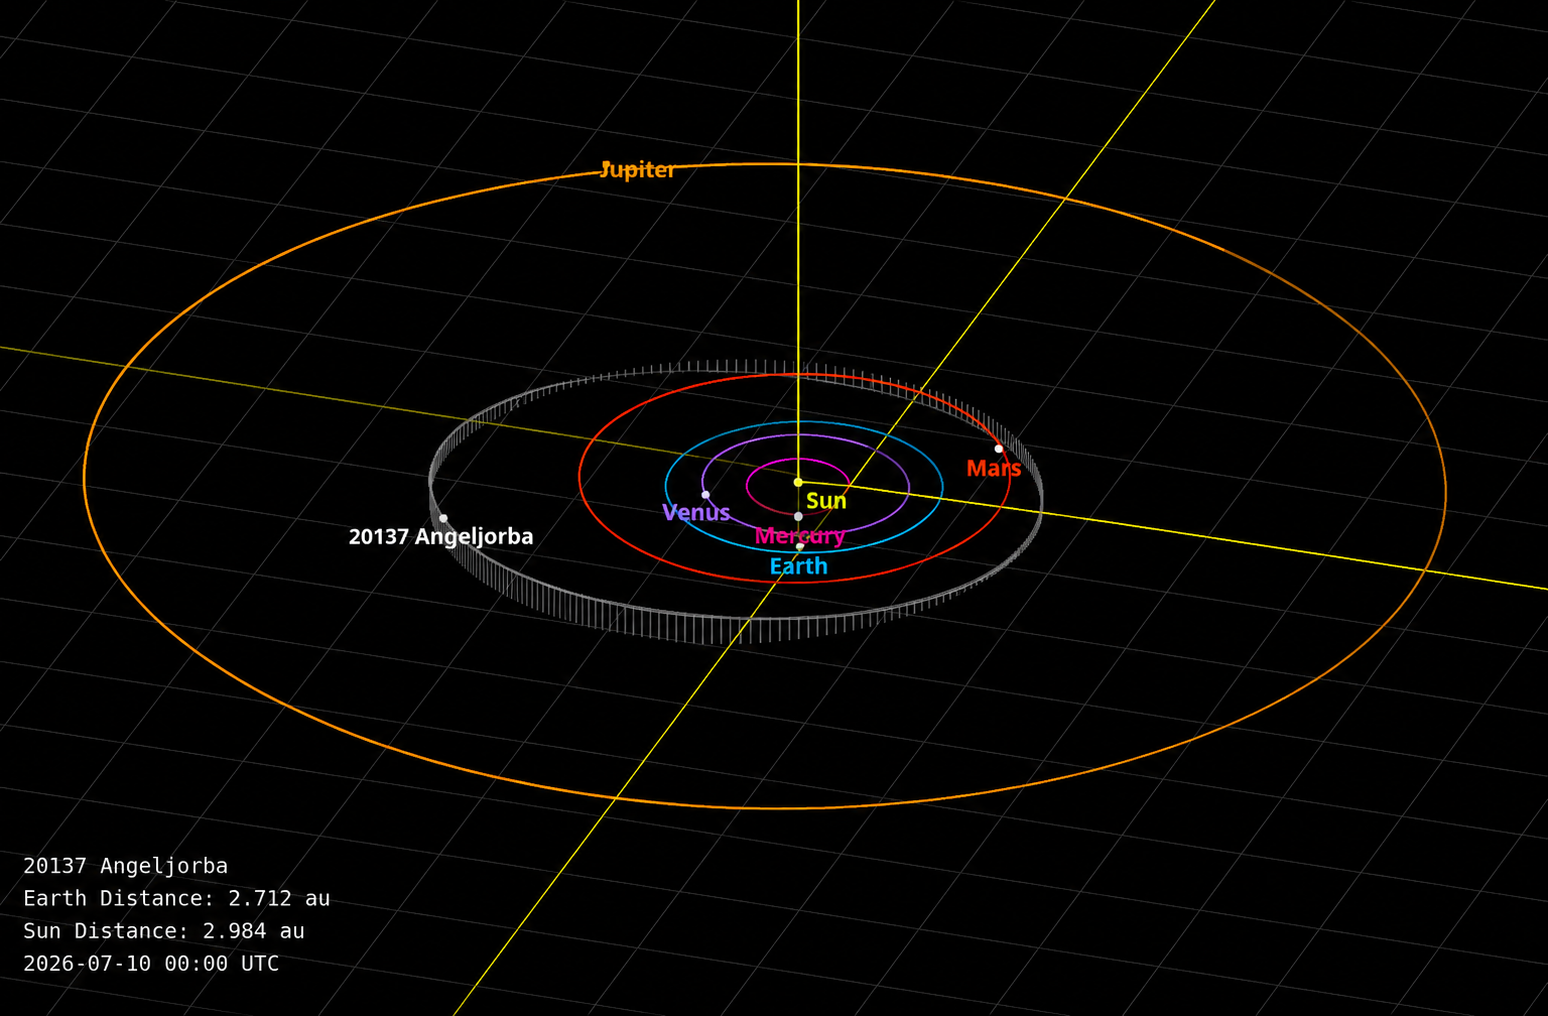
An asteroid now carries the name of Àngel Jorba
An asteroid has been named (20137) Àngeljorba in honour of Àngel Jorba (1963-2025), UB professor and CRM affiliated researcher. Approved by the IAU, the name recognises his career in dynamical systems and celestial mechanics, from the orbital theory behind ESA's SOHO...
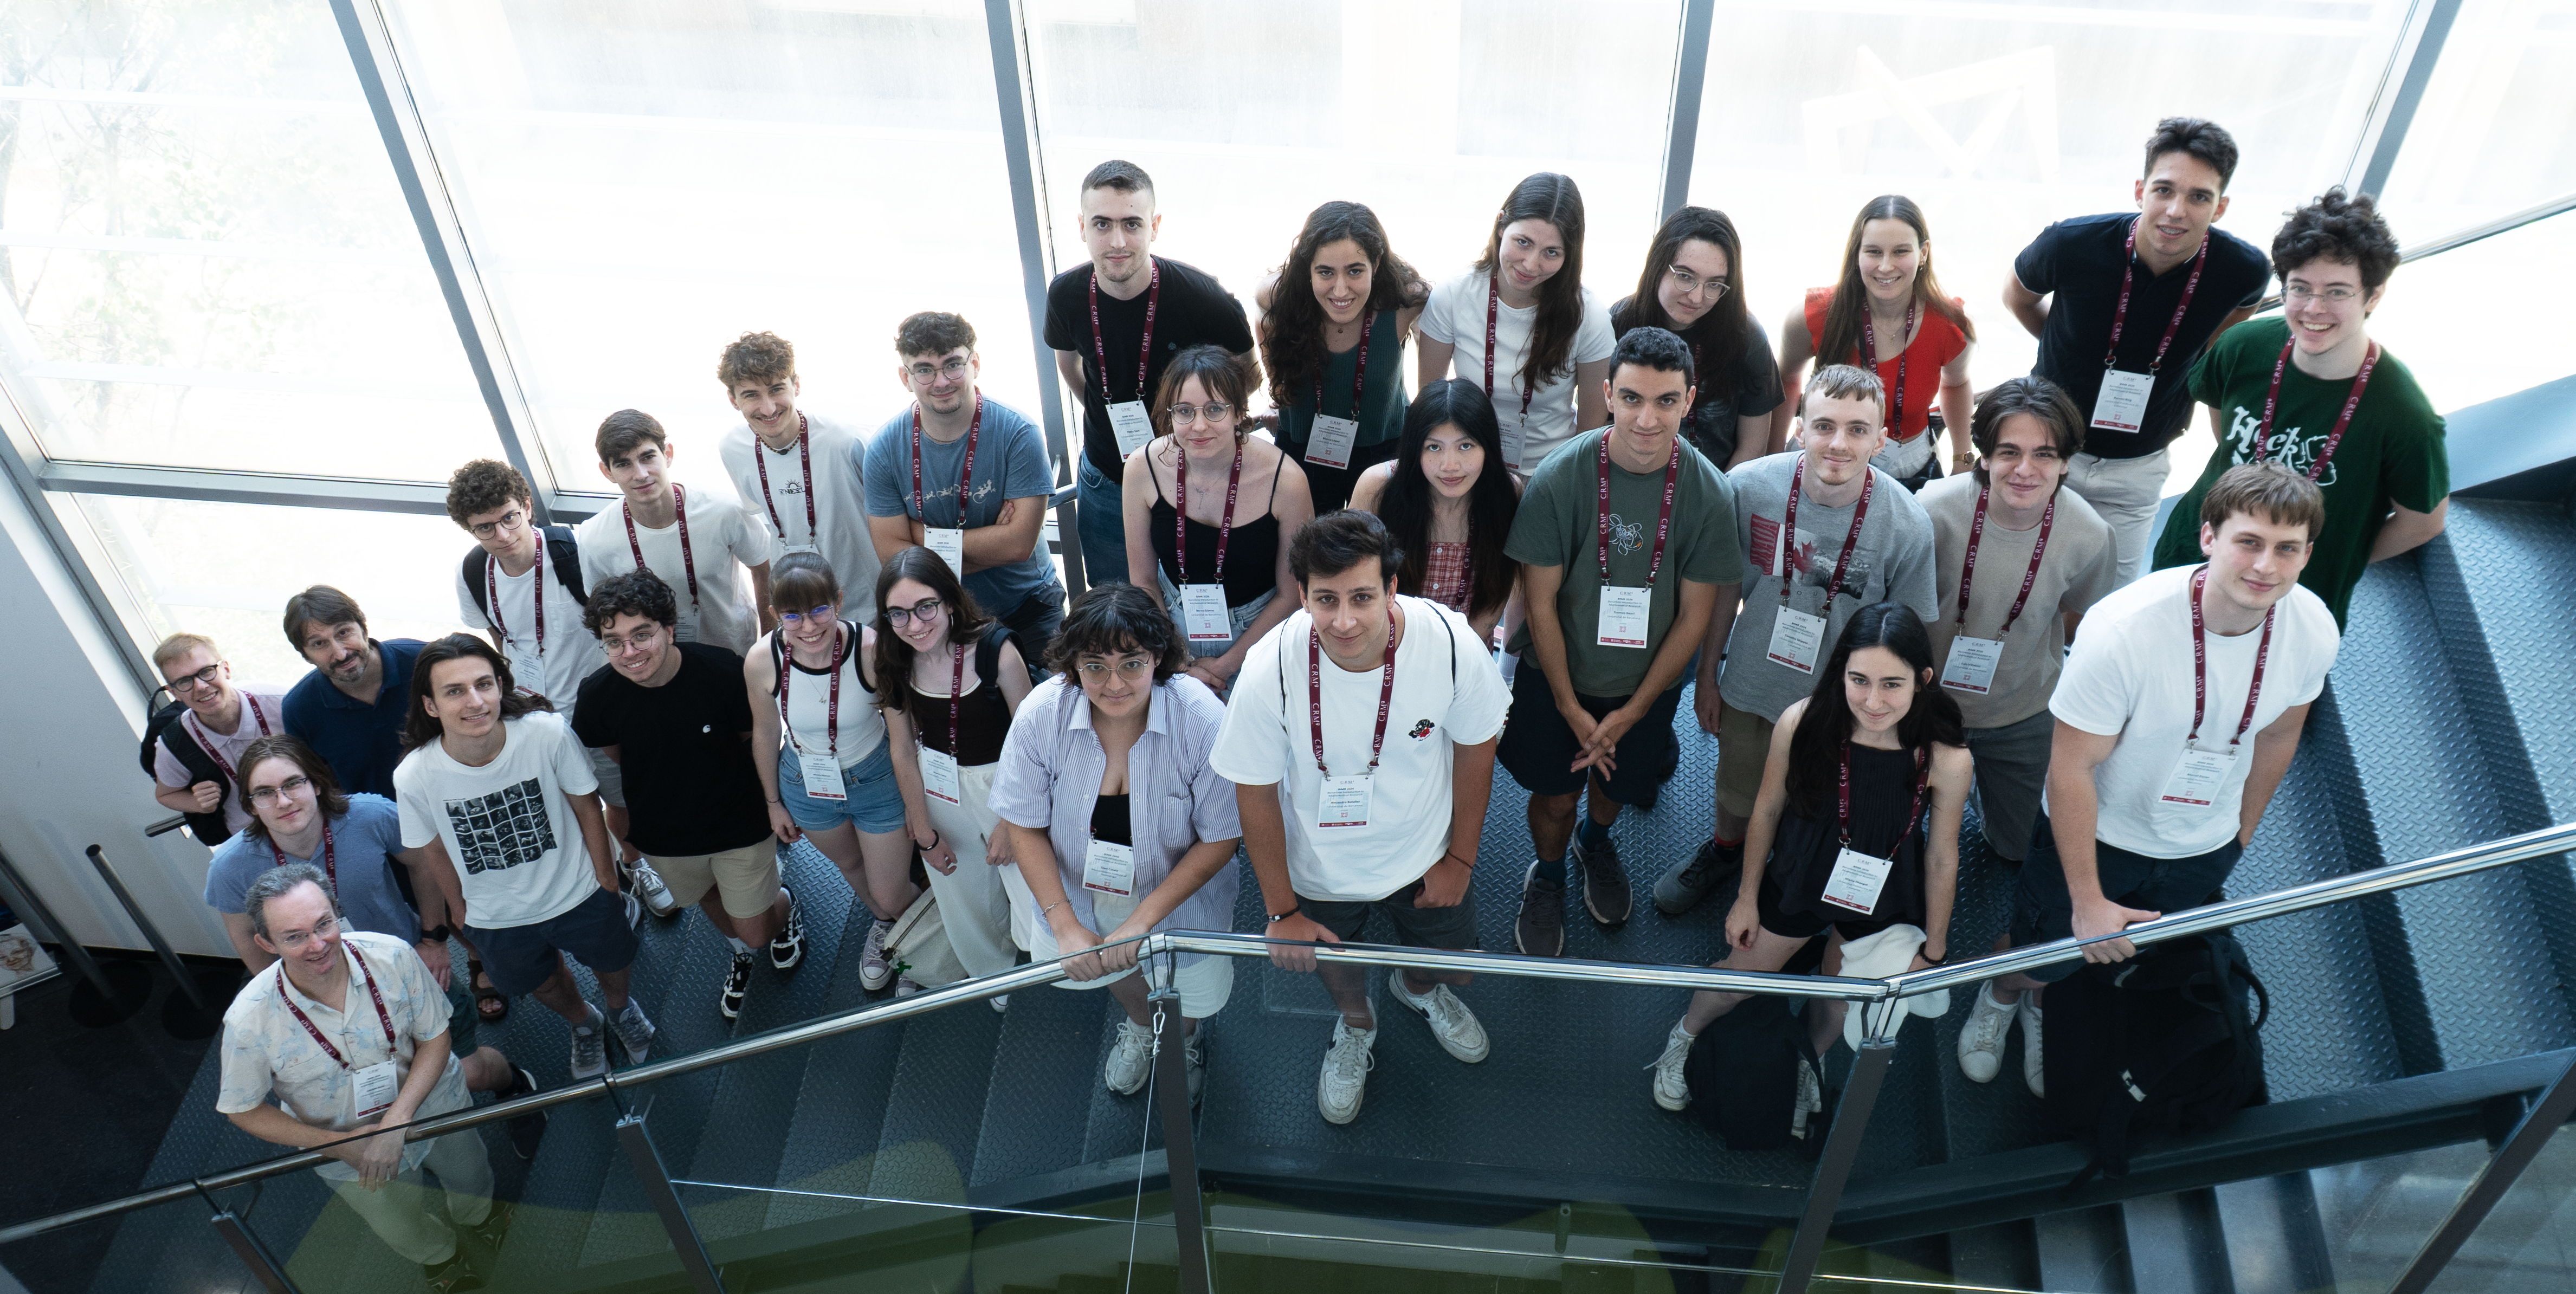
BIMR 2026: a first taste of research for future mathematicians
For four weeks in July 2026, the Centre de Recerca Matemàtica hosted the Barcelona Introduction to Mathematical Research (BIMR), a BGSMath summer programme built to give undergraduate and master's students a first, genuine experience of mathematical research and a...

Cambridge University Press publishes Single and Multiple Number Series, co-authored by Sergey Tikhonov (ICREA, CRM)
Sergey Tikhonov (ICREA, CRM) is one of four authors of the volume, published in the Encyclopedia of Mathematics and Its Applications series, which develops the theory of number series in one and several dimensions.Cambridge University Press has...
The 22nd JISD brings dynamical systems and PDEs to the CRM
The 22nd School on Interactions between Dynamical Systems and Partial Differential Equations (JISD) is taking place at the Centre de Recerca Matemàtica from 29 June to 3 July 2026. Four advanced courses and a poster session gather researchers in dynamical systems and...

CRM Annual Report 2025: A Year in Mathematics
CRM June Newsletter
ENHANCE Poster Earns Honorable Mention at FEniCS 2026 in Paris
Harmonic Analysis and PDEs Summer School at the CRM
Four mini-courses, from incompressible fluids to the geometry of boundaries, around a shared body of technique. CRM Auditorium, 15 to 18 June 2026.A rotating blob of fluid that never settles into rest. The ragged edge of a region in the plane. A weighted inequality...

An extension to higher dimensions of Carleson’s ε² conjecture
A recent article by Ian Fleschler (Princeton University), Xavier Tolsa (UAB – ICREA – CRM) and Michele Villa (Ikerbasque and UPV/EHU), published in Inventiones Mathematicae, establishes a higher-dimensional version of the well-known ε² conjecture of Carleson, a...